Aaron Johnson Designer & Artist*

I'm currently updating my portfolio. In the meantime, here's a selection of amuse-bouches...

Information Graphic

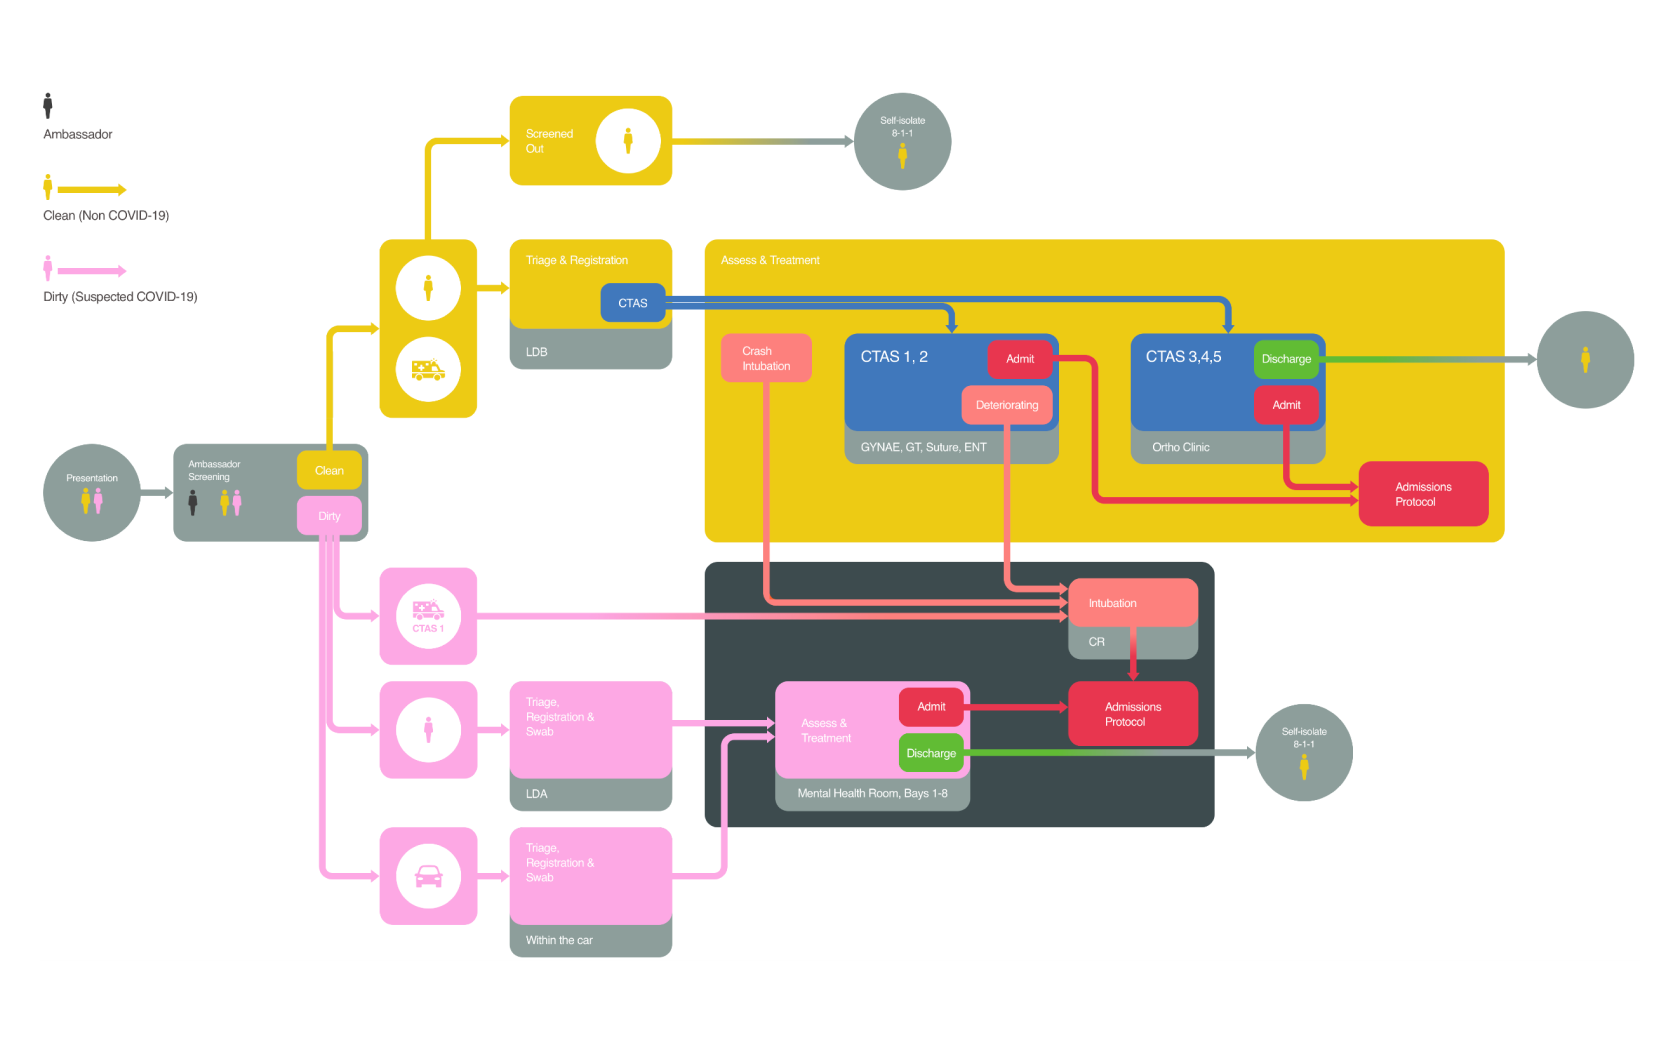
SPH Ambassador Screening Workflow

2020 saw COVID-19 become a very real threat to global public health, potentially putting local healthcare providers such as hospitals in danger of becoming overwhelmed.

I was asked to design a process that sorted presenting patients into two different cohorts, so that those COVID negative individuals needing hospitalization could be treated in safety without increasing the risk of infection spread.

I listened to healthcare leaders to understand how patients move through the site depending on their condition and required continuum of care. The physical space was divided up into two zones and a specific patient journey was created for each of those zones. I designed a map and process chart that helped staff navigate these two spaces as well as understanding what services and options were available in each and how to react should a patient need to transition from one zone to the other.

Patients were prioritized efficiently and safely. Staff on the site were able to focus on those in immediate critical need which preserved capacity and reduced the chance of outbreak due to infection spread.

Change Management Strategy
Design Leadership
Design Workshop
Information Design
Mentoring
Policy
Prototyping
Service Blueprinting
Strategy/Vision
Workflow Mapping
Information Graphic
Information Graphic
Information Graphic

FlyClear® by LifeLabs®

Air Canada needed to ensure aircraft crew were safe to return to duty as flights resumed following the COVID-19 pandemic.

I was asked to create a system that would enable individuals to prove they were COVID-19 free as they entered the work environment.

I created a digital pass card system. The status of the individuals card was determined by the result of a COVID-19 test submitted to a partnering lab. I collaborated with LifeLabs to understand what kind of information could be securely and safely displayed on the pass. I created wireframes and a simple prototype to test the workflow and then designed an easy to scan pass card interface.

Ultimately, the application helped crews back to flying status which helped the economy begin to recover. The success of the system allowed us to pick and sell the product to other organization, including Netflix who used it for Actors and film crews on location.

Design Leadership
Design Workshop
Discovery
Ecosystem Design
IXD
Mentoring
Policy
Product Design
Prototyping
Service Blueprinting
Strategy/Vision
User Journeys
User Research
UXD
Wireframes
Workflow Mapping
Information Graphic

BCi Assets under management digital transition

With $233.0 billion of gross assets under management, as of March 31, 2023, British Columbia Investment Management Corporation (BCI) is the provider of investment management services for British Columbia’s public sector and one of the largest asset managers in Canada. They relied on email and spreadsheets to communicate trade requirements far all the assets under management. The back-and-forth between members of multiple teams often causes delays in trades being approved.

I was asked to look at ways the communications workflow could be streamlined and in some places automated.

I interviewed each team to understand how they went about their tasks, mapping out the entirety of the trade process from recommendation to completion. I facilitated many design workshops to break down the different parts of the process, giving the opportunity for the group to suggest gaps, challenges and potential alternative practices. As the new process evolved, we used analogue testing to prove approach and t challenge assumptions. The insights from these sessions as well as design artefacts I produced were used to build the final product.

Because I removed the need for email and spreadsheets by designing ‘one source of truth’, automated calculations and reduced manual input improved data quality and made asset management tasks quicker allowing for greater accuracy in trade forecasting. It also sped up the overall time between recommendations and completing allowing portfolio managers more time to concentrate on other tasks.

Change Management Strategy
Design Leadership
Design Workshop
Discovery
Ecosystem Design
IXD
Mentoring
Policy
Product Design
Prototyping
Strategy/Vision
User Journeys
User Research
UXD
Wireframes
Workflow Mapping
Information Graphic
Information Graphic

ThoughtExchange Comparisons

ThoughtExchange had three different comparison experiences across one platform. With a different location and different functionality for each, it created a lot of confusion for users.

I was asked to create a single, unified comparison experience that worked across multiple scenarios.

I looked at data to understand which of the different versions were being used most. I ran a survey with customer success colleagues to understand how individuals were using the compare functionality as well as how it was being sold. I ran several design / discovery sessions with a group of CSM's to explore options and gaps as well as using real data to test new ideas. I created a conversational “fill in the blanks” interface to test a new approach to the initial query which I made into a prototype for further testing. I also designed an entirely new interface with improved accessibility in which to display the results.

Not only did we see a much improved feature, the collaboration with colleagues outside of product fostered a new sense of trust and inclusion. The SME team appreciated having a voice and felt heard. Most importantly, the new functionality helped sway the decision of two major clients renewing their contracts.

Design Leadership
Design Workshop
Discovery
Ecosystem Design
IXD
Mentoring
Product Design
Prototyping
Service Blueprinting
Strategy/Vision
User Journeys
User Research
UXD
Wireframes
Workflow Mapping
Information Graphic

Canada/Provincial COVID-19 app

This needs a STAR Satement!

The first iteration of the Canada COVID-19 app was rudimentary - built and released in 5 days to meet a challenge with many unknowns. Multiple iterations and rapid prototyping helped the app evolve into a fully accessible, inclusive accurate source of data and citizen resources.

Design Leadership
Design Workshop
Discovery
Ecosystem Design
IXD
Mentoring
Policy
Product Design
Prototyping
Strategy/Vision
User Journeys
User Research
UXD
Wireframes
Workflow Mapping
Information Graphic

Donations Kit for Benevity

Benevity had several platforms with a donation mechanism. Each one was maintained individually and over many years had become complex, structurally fragile and ultimately inconsistent.

I was asked to create a unified, extensible payment experience that would work in different contexts.

I compared each example, using the essential common components as my starting place. I then researched patterns used by other organizations and iterated. I looked at specific requirements from different regions and designed a library of components that would dynamically react depending on context. I built a simple prototype and tested my new proposed workflow out in the community. Finally, I designed an entirely new look and feel for the interface ensuring accessibility and extensibility across different devices.

In the 12 months post release of the new feature, there was a 9% reduction in drop off compared to the previous year. With that years total donation volume for at over $1 billion that translates to approximately $90 million.

Design Leadership
Design Workshop
Discovery
Ecosystem Design
IXD
Product Design
Prototyping
Strategy/Vision
User Journeys
User Research
UXD
Wireframes
Workflow Mapping
Information Graphic

PROMIS for PRA

Staff at the Pacific Renal Agency were using a care management system that was outdated and becoming increasingly unstable. Critical data was often replicated because patient details were siloed and inaccessible due to permissions.

As the underlining technical architecture was being rebuilt, I was asked to explore options to improve the overall experience for the various members of the care team.

I advocated for close collaboration with chronic kidney disease patients to build empathy and better understand the patient journey. Once mapped, I invited different members of the care team indicate their primary touch point as well as interactions and information that would be of benefit. I used this as the basis on which to surface appropriate data for each role based interface I designed. After iterating and testing prototypes, each fully fleshed component was used to build the final application.

Data accessibility and usability vastly improved. Because silo’s had been broken and the chance to corrupt or skew information had been removed, members of the care team had an accurate, holistic picture of the patients care continuum and so patient outcomes improved.

Change Management Strategy
Design Leadership
Design Workshop
Discovery
Ecosystem Design
Information Design
IXD
Mentoring
Product Design
Prototyping
Strategy/Vision
User Journeys
User Research
UXD
Wireframes
Workflow Mapping